
Estimating Amazon Ad Incrementality for Sellers: How to Combine Switchback Tests with MMM
I don't have access to Amazon Marketing Cloud. Here is how I used a manual switchback experiment and Google Meridian to find the true value of my ad spend.

, MMM Median (1.42), Triangulated (1.54), MMM Mean (1.79), and Amazon Reported (2.35)")
The hierarchy of ad performance: From Amazon’s optimistic reporting to the conservative experimental floor, and finally the triangulated reality.
If you are a massive seller on Amazon, measuring ad effectiveness is “easy.” You pay for Amazon Marketing Cloud (AMC), run user-level holdout tests, or deploy geo-segmentation experiments to see exactly how much incremental revenue your ads are driving.
But I am a smaller seller ($20k annual ad spend). I don’t have access to those enterprise tools, yet I have the same burning question they do: Are my ads actually driving new sales, or am I just paying to convert people who would have bought anyway?
To find out, I combined a manual switchback experiment with Marketing Mix Modeling (MMM). The result wasn’t just a number; it was a lesson in how different data views can triangulate the truth.
Level 1: The Platform “Truth” (The Fantasy)
If I simply log into Amazon Seller Central and look at my campaign performance, the numbers look great.
Ad-Attributed Sales Difference: ~$129 (On days vs. Off days)
Ad Spend Difference: ~$55
Platform ROAS: ~2.35
If I believed this number, I would be printing money. But I know better. Amazon Attribution is greedy—it often claims credit for “Organic” sales just because a user clicked an ad at some point in their journey. I suspected this 2.35 was heavily inflated by cannibalization.
Level 2: The “Naive” Switchback (The Floor)
To find the real lift, I designed a simple Switchback Experiment, alternating my ads “On” and “Off” daily for about a month (post-Christmas late Dec 2025 – Jan 2026).
The logic is simple: I don’t care what Amazon says the ads did. I only care if my Total Sales actually went up when the ads were on.
Here is what the raw experimental data told me:
Avg Daily Spend Difference: ~$55 (Treatment vs Control)
Avg Daily Sales Difference: ~$68.56 (Treatment vs Control)
Incremental ROAS: 1.25
The Reality Check: The drop from 2.35 to 1.25 is brutal. A 1.25 ROAS means that for every $1.00 I spend, I only get $0.25 in incremental revenue on top. Once you factor in shipping fees, cost of goods sold, and Amazon fees, a 1.25 ROAS is actually a loss.
If I stopped here, the logical business decision would be to shut off ads entirely.
The Problem: But this method is too conservative. A daily switchback assumes marketing has zero memory. It assumes an ad clicked on Monday only drives sales on Monday. In reality, there’s probably some leakage from day to day. A customer clicks on Monday, thinks about it and perhaps adds to cart, but then buys on Tuesday (when ads are Off). My experiment was giving “Organic” credit for some sales that “Ads” actually initiated.
I knew 1.25 was likely my performance floor, but I needed to measure that invisible carryover effect.
Level 3: Marketing Mix Model
To capture that delayed effect, I fed my experimental data into Google Meridian, an open-source Marketing Mix Model (MMM). Unlike my manual spreadsheet, Meridian uses Bayesian statistics to estimate how ad spend drives incremental sales over time.
The model confirmed my suspicion:
Adstock Decay (alpha): ~0.35 (Meaning ~35% of ad pressure bleeds into the next day).
Posterior ROAS: The model was much more optimistic, but also highly uncertain.
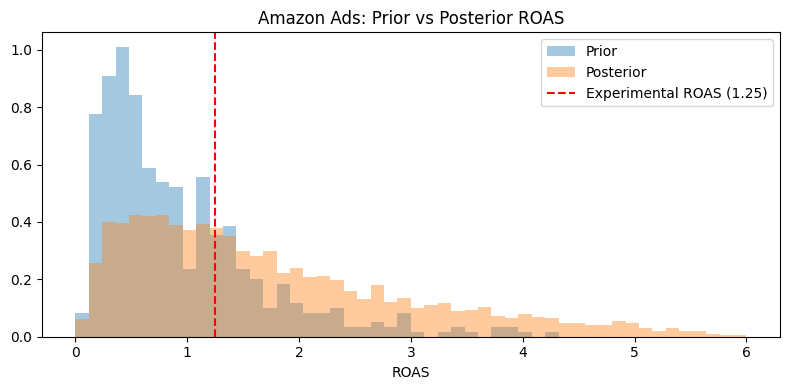
The model (orange) suggests a ROAS higher than the experiment (red line), but with a wide range of uncertainty.
Experimental ROAS: 1.25
Model Posterior Median: 1.42
Model Posterior Mean: 1.79
90% Credible Interval (MMM): 0.27 – 4.57
The switchback experiment had a fairly wide confidence interval, but the credible interval for the MMM estimated ROAS was even wider. It suggests the true ROAS is higher than 1.25, but it’s too fuzzy to bank on.
Level 4: The Triangulation (The “Sweet Spot”)
This is where the magic happened. I could combine the experiment with MMM, using the model’s structural insight (the 0.35 decay rate) to update the experiment’s math.
In my original calculation, I divided the sales lift ($68.56) by the difference in spend ($55). But because of that 0.35 decay rate the model found, the difference in actual “ad pressure” (adstock) on any given day wasn’t $55. It was lower ($44.43), because “Off” days still carried leftover pressure from previous “On” days.
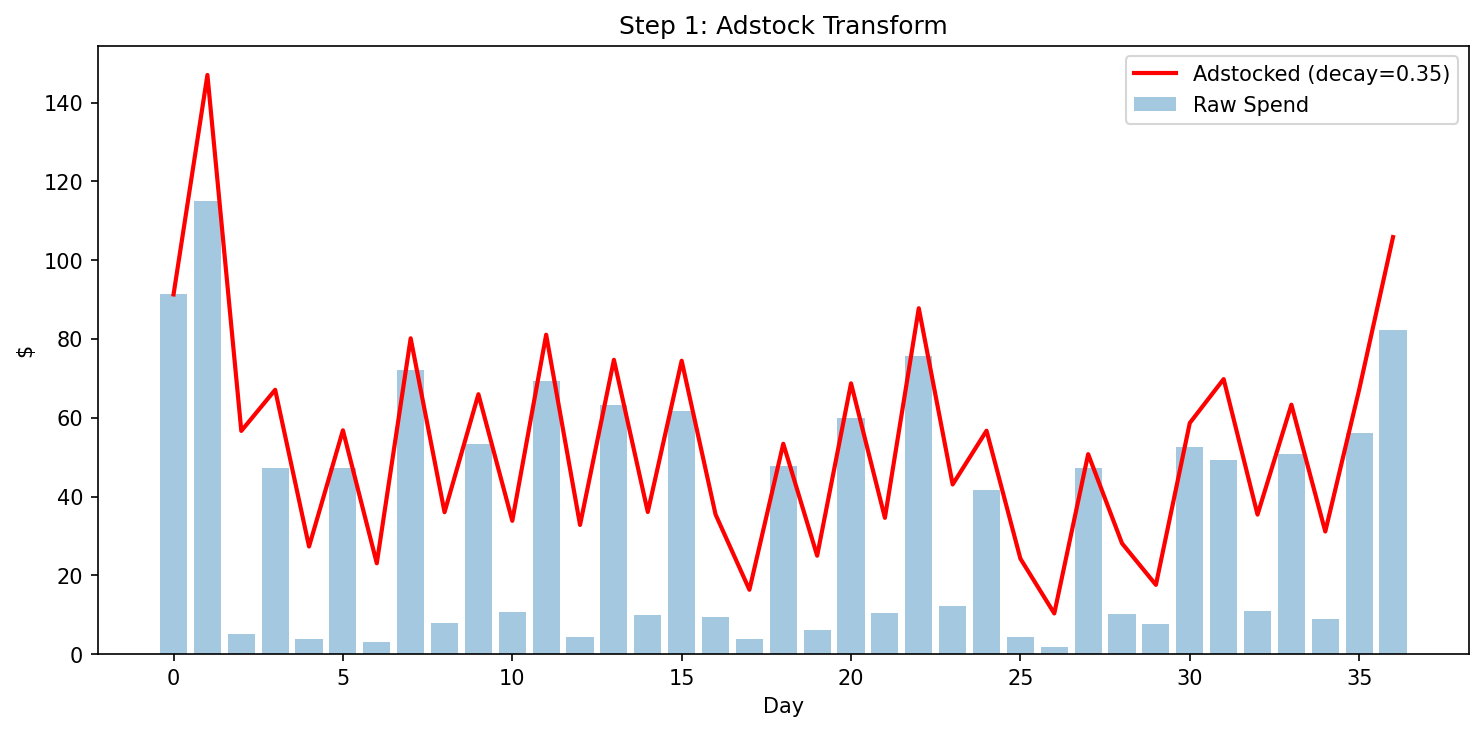
Visualizing the “bleed”: The red line shows how ad pressure lingers even when raw spend (blue bars) drops close to zero.
Instead of dividing sales lift by the difference in raw spend, I first transformed each day’s spend into “adstocked spend” — accounting for yesterday’s carryover using the model’s 0.35 decay rate. Then I re-ran my experimental math:
Avg Adstock (Treatment days): $74.72
Avg Adstock (Control days): $30.29
Adstock Difference: $44.43 (vs $55 raw spend difference)
Sales Lift: $68.56 (same as before)
Adstock-Adjusted ROAS: $68.56 / $44.43 = 1.54
This 1.54 sits perfectly between the conservative experimental floor (1.25) and the optimistic MMM estimates (median 1.42, mean 1.79). By accounting for carryover, I’m no longer penalizing ads for sales they triggered on “Off” days.”
Conclusion: Trusting the 1.54
This result—1.54 ROAS—is an intriguing estimate.
It is lower than the Platform Fantasy (2.35).
It is higher than the zero-decay estimate from the switchback (1.25).
And it lands perfectly between the Marketing Mix Model’s Median (1.42) and Mean (1.79).
By triangulating these methods, I have increased confidence in the incremental sales driven by ad spend on Amazon.
For small sellers, the lesson is clear: You don’t need a $50k tech stack. You need a simple On/Off test to anchor your data, an open-source model to estimate the decay, and a calculator to bridge the gap.
Find me on the web and social media
WhatsTheImpact.com: Coaching and consulting
TikTok (nearly 30k subscribers)
LinkedIn (nearly 10k followers)
Instagram (help me grow!)
YouTube (longer form tutorial videos)
Hey Jonathan,
Great post!
Do you mind sharing the notebook/code for the project?